NEPAMesh's Four Dashboards, Explained: Map, View, Monitor, and Propagation
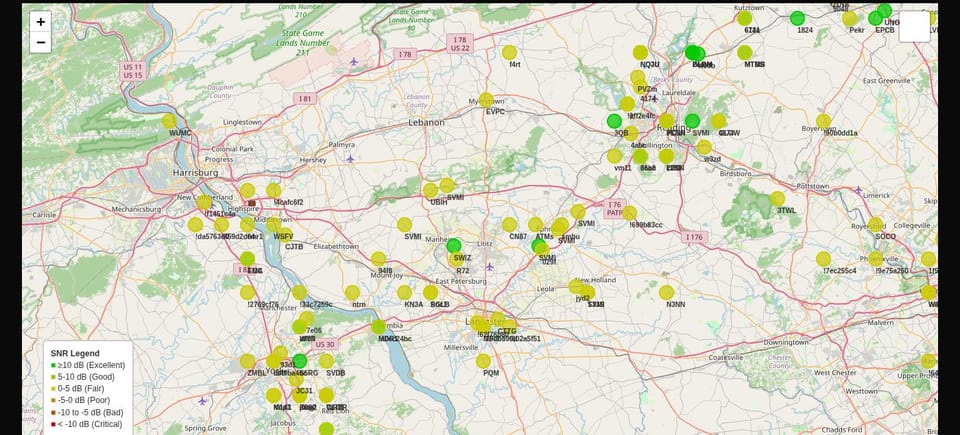
NEPAMesh has two new pages up: view.nepamesh.com and monitor.nepamesh.com. Both are free, open source Meshtastic tools pulled straight from GitHub, not something built in house. Here's what each one actually shows you, in plain terms.
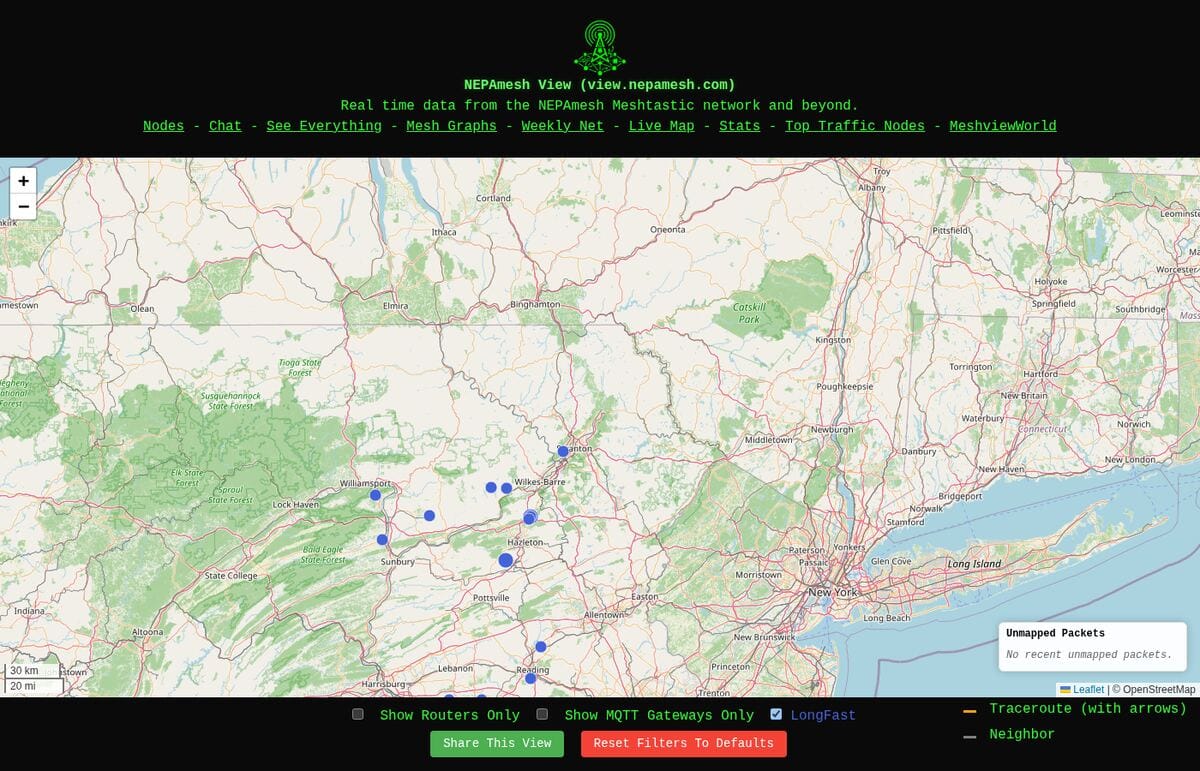
That brings NEPAMesh up to four public dashboards in total, counting the two that already existed: map.nepamesh.com and propagation.nepamesh.com. Four pages is a lot to keep straight, so past the Meshview and MeshMonitor writeup below, this post also walks through all four, one at a time, with a screenshot of each so you know what you're looking at before you click.
The navigation bar on nepamesh.com has been updated too, so both new tools now show up in the menu alongside the live map and propagation tool instead of being links you'd only find in a post like this one.
Meshview: What's Being Said
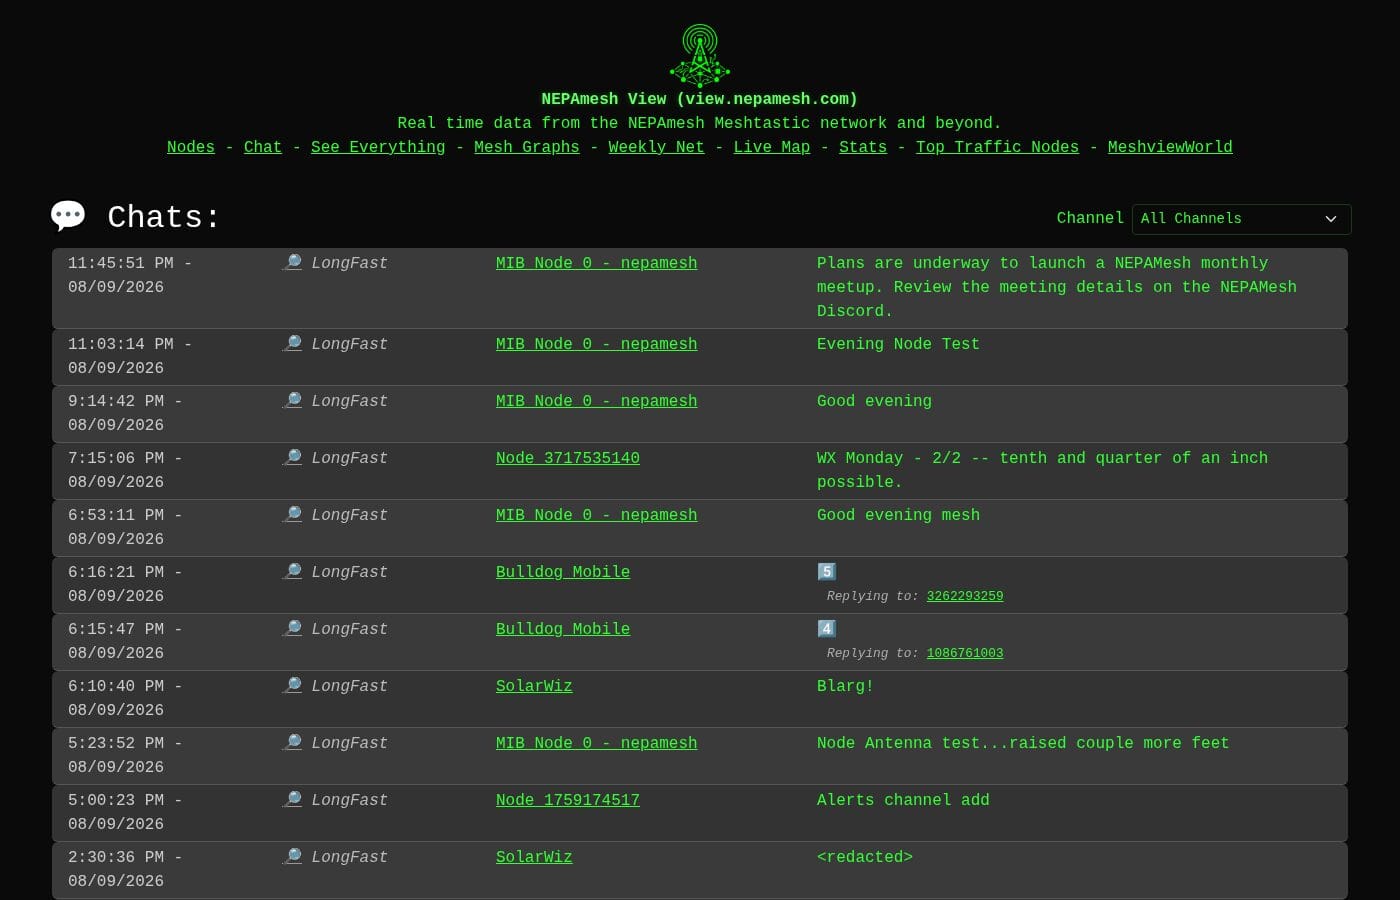
view.nepamesh.com runs Meshview, a project built by Pablo Revilla. Think of it as a window into the mesh's conversation.
Every Meshtastic node broadcasting on NEPAMesh's public channels sends its packets out over the air, and a chunk of that traffic also flows through MQTT, the messaging backbone NEPAMesh bridges to the internet. Meshview sits on that feed, saves everything it sees to a database, and gives you a web page to browse it.
What you'll find there:
- A live chat feed. Text messages sent on public channels, as they happen.
- Node pages. Click any node and see its recent activity, battery and signal readings, and the packets it's sent.
- Traceroutes. A visual trail of exactly which nodes relayed a packet from sender to receiver, hop by hop.
- Traffic stats. Who's talking the most, how busy the channel is, and how that's changed over time.
If map.nepamesh.com answers "where are the nodes," Meshview answers "what are they saying, and how did that message actually get here." It's the closest thing NEPAMesh has to a public radio log.
MeshMonitor: How the Hardware Is Doing
monitor.nepamesh.com runs MeshMonitor, built by Yeraze. Where Meshview is about messages, MeshMonitor is about machines.
It connects to nodes directly, over TCP, serial, or Bluetooth, plus MQTT, and keeps a running log of what each device is reporting about itself: battery percentage, voltage, signal quality, uptime, firmware version, position. The dashboard turns that into something you can actually read at a glance instead of digging through raw telemetry packets.
One caveat worth knowing: NEPAMesh's instance runs on a remote server, not on a machine sitting next to a node, so it reaches the mesh over an MQTT bridge instead of a direct TCP, serial, or Bluetooth link. That's enough for MeshMonitor to watch everything crossing the bridge, telemetry, positions, messages, but it can't reach back and act on the mesh the way a locally connected instance could, sending a message or pushing a config change to a node. In this deployment, think of it as a passive listener, not a control panel.
What you'll find there:
- Node status at a glance. Which nodes are online, which have gone quiet, and when each was last heard from.
- Battery and signal history. Charts showing how a node's power and link quality have trended, not just a single snapshot.
- An interactive map with terrain. Node positions plotted against real elevation data, useful for understanding why a node can or can't reach another one.
- Device details. Firmware version, hardware model, and configuration info pulled straight from the node.
If you run a node and want to know how it's actually performing, not just whether it shows up as a dot on a map, this is the page for that.
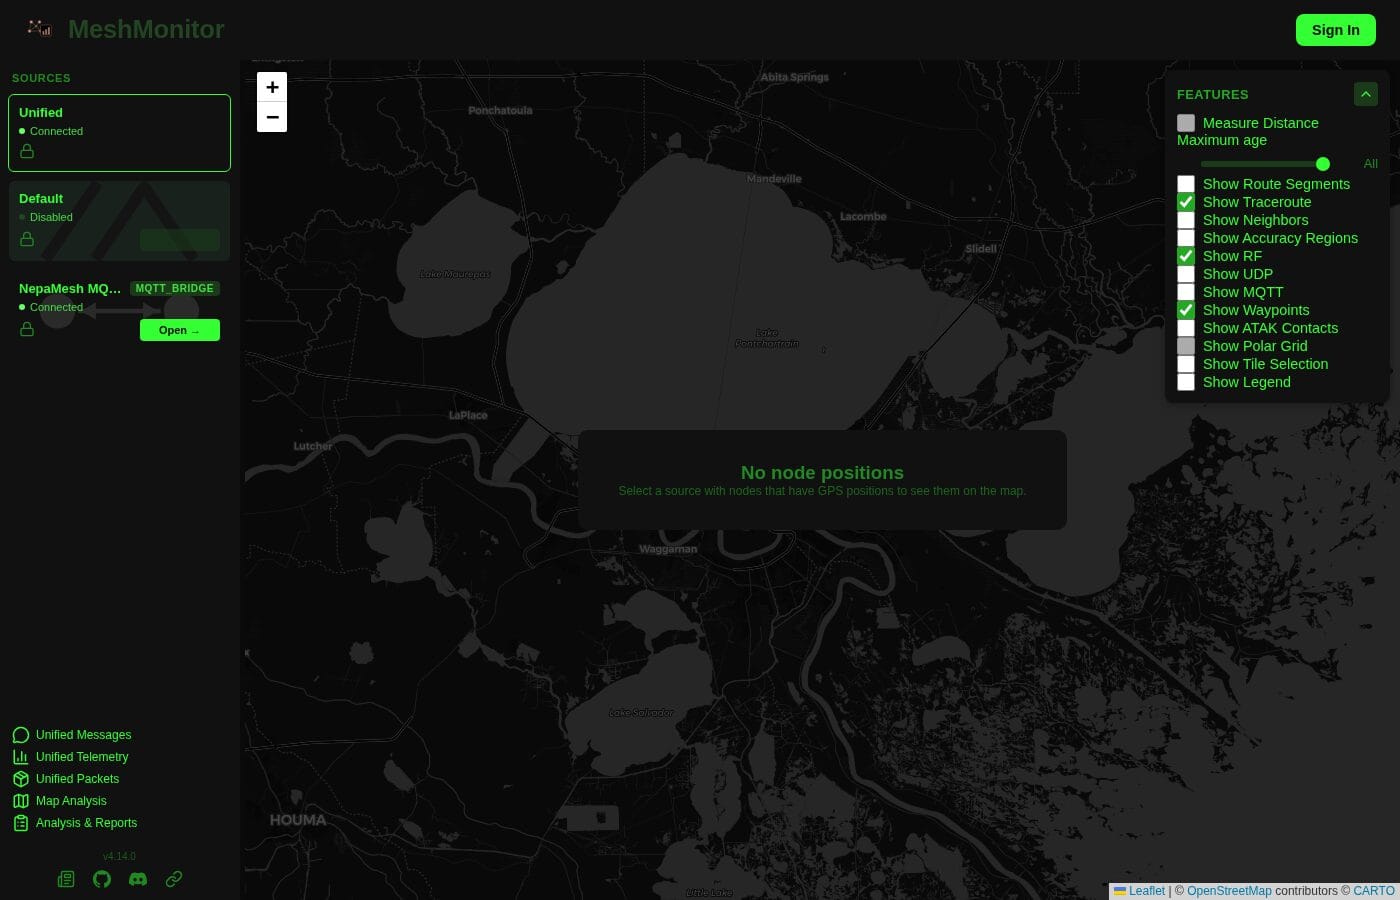
One difference from Meshview: MeshMonitor's node data, map, and message views sit behind a sign in for public visitors. Anyone can load the page and see the interface, but viewing live node details currently requires an account. Message the Discord for a username and password.
Why Two Pages Instead of One
Meshview and MeshMonitor were built by different people, for different questions. One is about the traffic crossing the mesh. The other is about the health of the radios carrying it. Running both side by side gives NEPAMesh a fuller picture than either tool provides alone, and since both are already actively maintained open source projects, NEPAMesh gets that picture without having to build and maintain the equivalent from scratch.
Neither one replaces map.nepamesh.com or propagation.nepamesh.com. Think of all four as different lenses on the same network: the live map for where nodes are, MeshShadow's propagation tool for coverage and RF analysis, Meshview for the conversation, and MeshMonitor for hardware health.
ELI5: All Four Dashboards, One at a Time
Four pages, four different jobs. Here's the plain English version of what each one is for, in the order you'd actually reach for them: where is everyone, will my signal get there, what's being said, and how healthy is the gear.
map.nepamesh.com: "Where is everyone?"
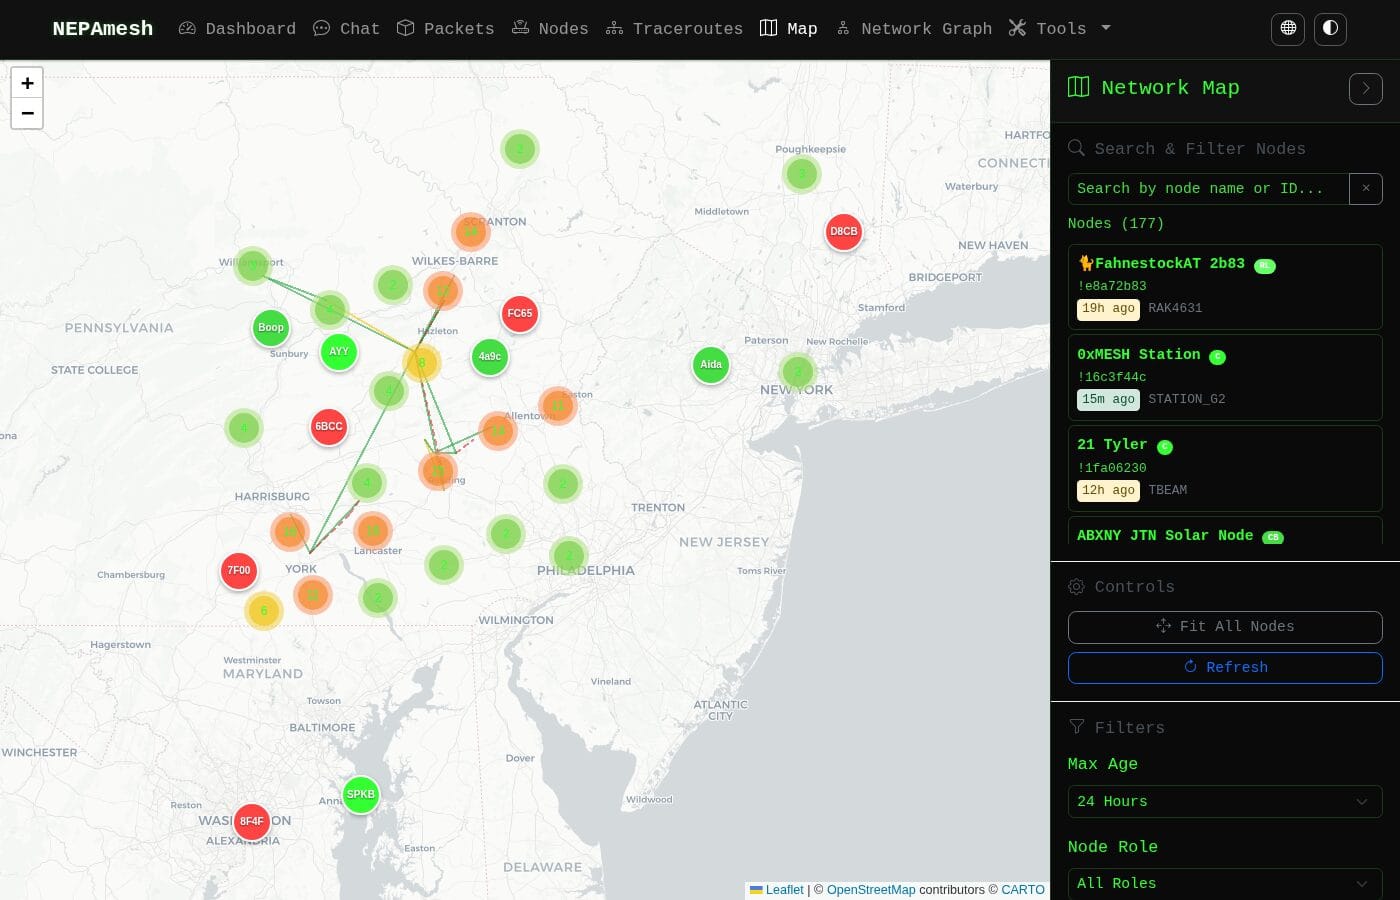
This is the front door, the one most people check first. Every colored dot on the map is a Meshtastic node that's checked in recently. Green usually means recently active, red or orange means it's been a while since anyone heard from it. Click a dot and a panel opens with that node's name, ID, hardware, and when it last showed up.
The lines connecting some of the dots are traceroutes, actual paths a message took hopping from node to node to get where it was going. If you're new to the network, this is the page that answers "is NEPAMesh actually near me," fastest.
propagation.nepamesh.com: "Will my signal actually reach that spot?"
map.nepamesh.com shows you where nodes are. MeshShadow shows you where radio signal actually can and can't go, which is a very different question. Hills, valleys, and distance all bend or block LoRa radio in ways that aren't obvious just from looking at a map of dots.
Unlike Meshview and MeshMonitor, MeshShadow isn't a project NEPAMesh adopted off GitHub, it's built in house, specifically because the Wyoming Valley's terrain makes coverage hard to reason about with a flat map alone. Ridges and valleys create dead zones a simple distance calculation would miss entirely, so MeshShadow models the terrain itself rather than just plotting node positions.
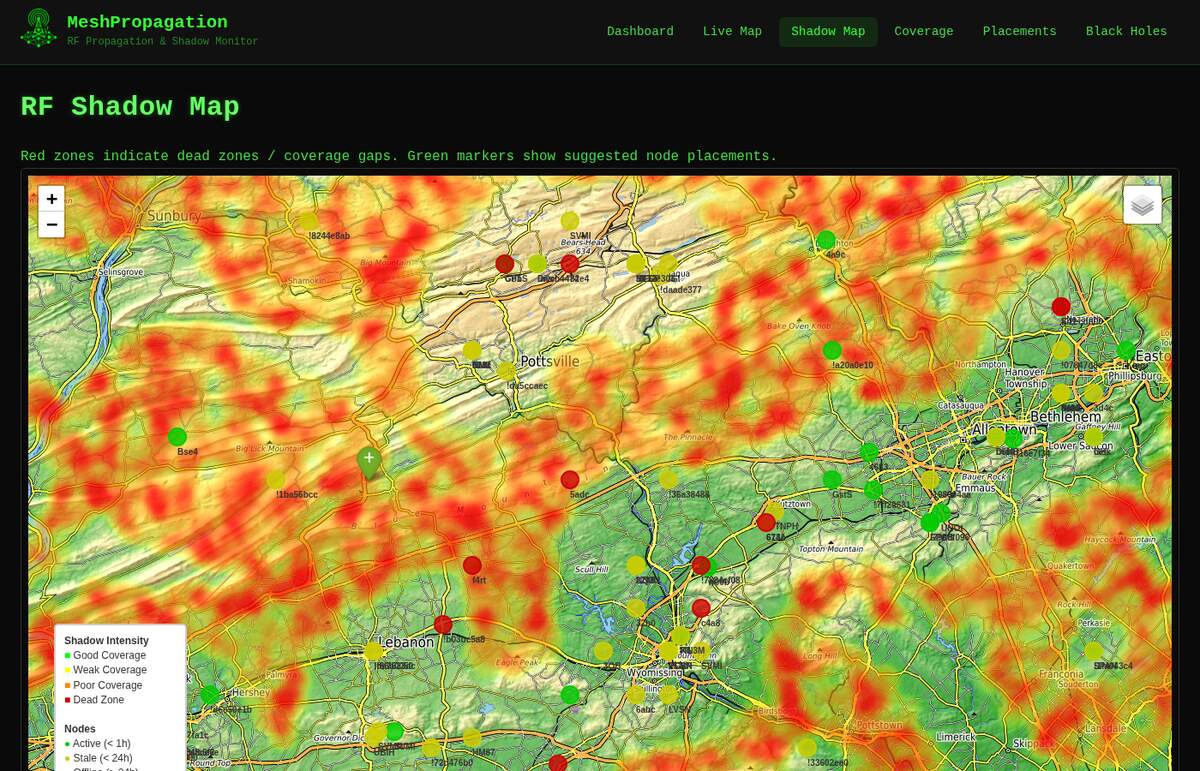
The Shadow Map is the page to know. Green patches mean good coverage. Yellow and orange mean it's getting weak. Red means dead zone, a spot no NEPAMesh node currently reaches well. If you're trying to figure out whether a new node in your backyard would actually help, or deciding where to mount an antenna for the best shot at reaching the rest of the mesh, this is the tool built for exactly that question.
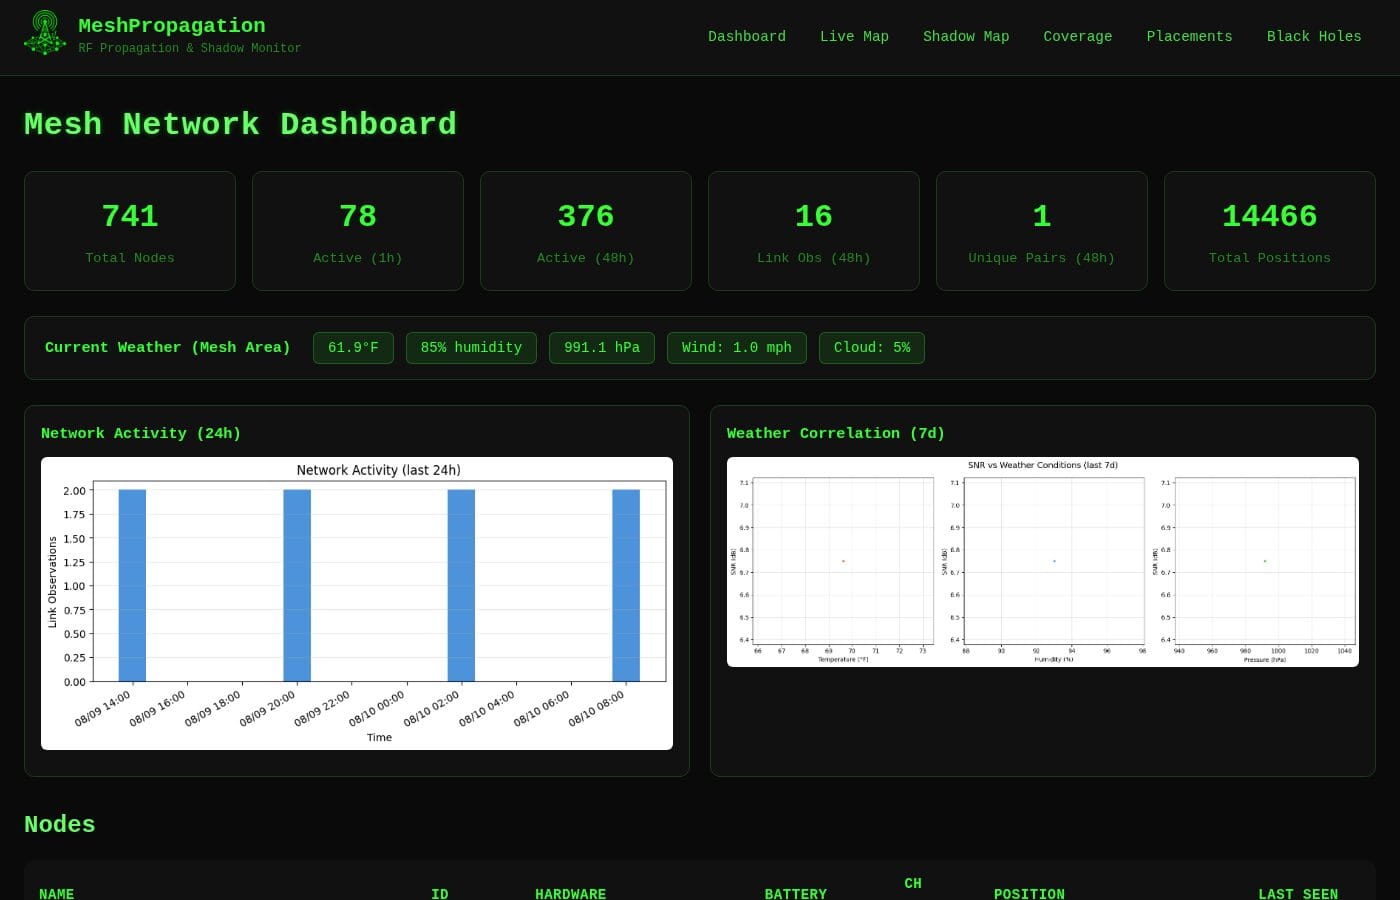
The Dashboard tab on the same site is worth a look too, a running tally of total nodes, how many are active, and current weather at the mesh area, since weather affects how far a signal carries.
view.nepamesh.com: "What's being said, and how did it get here?"
This is Meshview, covered above. Two pages on the site are worth knowing by name once you're past the chat feed.
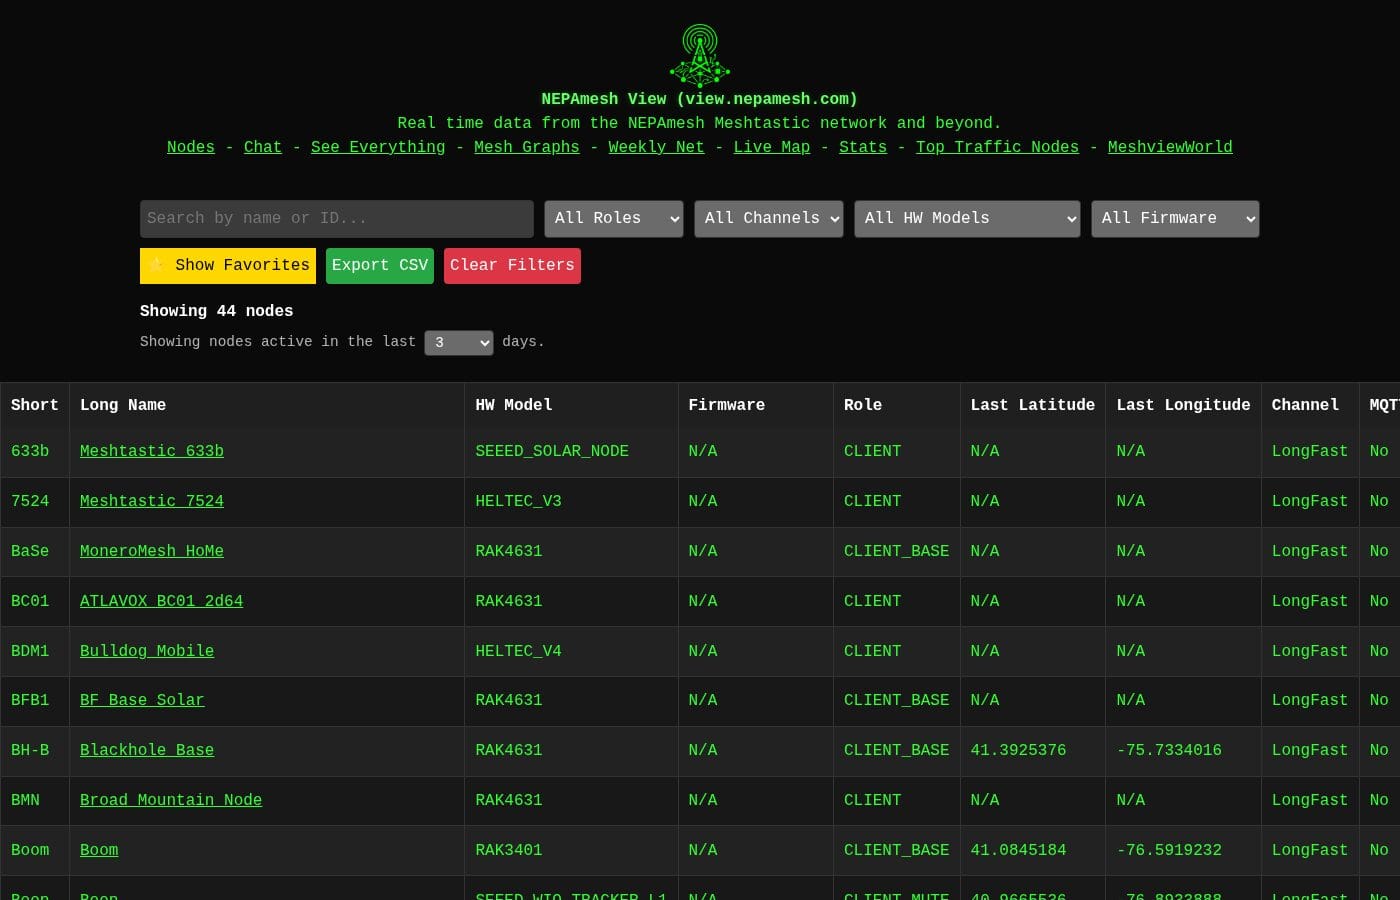
The Nodes page is a searchable table, every node NEPAMesh has heard from recently, with its hardware model, firmware, role, and last known position, all in one sortable list. Faster than clicking through the map one dot at a time if you already know roughly what you're looking for.
The Live Map tab is different from map.nepamesh.com's map, worth not confusing the two. This one is built around traceroutes and MQTT gateways specifically, showing the actual paths messages took across a much wider area than NEPAMesh alone covers, since Meshview watches the broader MQTT feed, not just local traffic.
monitor.nepamesh.com: "How healthy is the gear?"
This is MeshMonitor, also covered above. The short version for this walkthrough: it's built for people who own or care about a specific piece of hardware, not for browsing the network at large. Battery draining too fast, signal quality slipping, firmware falling behind, that's what it's watching for. Because it's watching over MQTT rather than sitting directly on the mesh, treat it as a passive listener here, not something that can reach back and act on a node.
As mentioned earlier, most of that detail sits behind a sign in. What you'll see without one is the shell of the interface: the sources panel on the left, the map, the menu of analysis tools along the bottom. Enough to know what the tool does, not enough to see live node data unless you're signed in. A username and password are available on request in the Discord.
Try Them Out
- map.nepamesh.com to see where nodes are right now
- propagation.nepamesh.com to see where signal actually reaches, and where it doesn't
- view.nepamesh.com for the chat feed, node pages, and traceroutes, open to anyone, no login needed
- monitor.nepamesh.com for battery, signal, and terrain-aware node status, sign in required, message the Discord for a username and password
Questions or feedback go in the Discord.
NEPAMesh is a community Meshtastic network covering Northeastern Pennsylvania's Wyoming Valley. Live map at map.nepamesh.com. Questions in the Discord.
Meshtastic is a registered trademark of Meshtastic LLC. No warranty is provided. Use at your own risk. This post is not endorsed by or affiliated with Meshtastic LLC.