Coming Soon: Propagation Monitoring for NEPAMesh
Been working on something new for the NEPAMesh network. It's not quite ready for prime time yet, but it's far enough along to show off.
Meet propagation.nepamesh.com – a passive RF propagation monitor for the mesh. It watches the network, tracks how signals move between nodes, correlates that with weather data, and figures out where our coverage gaps are. All without transmitting a single packet.
The Dashboard
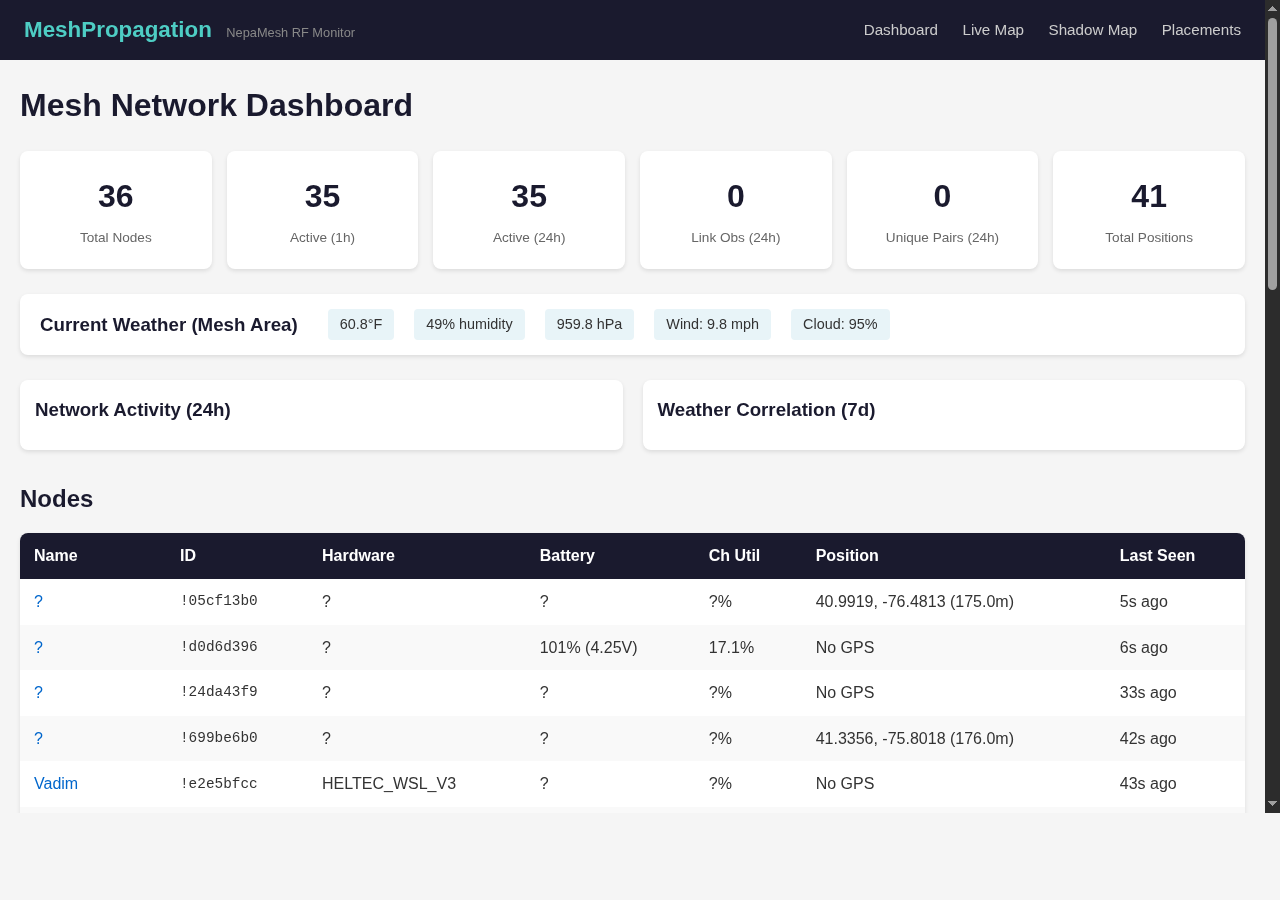
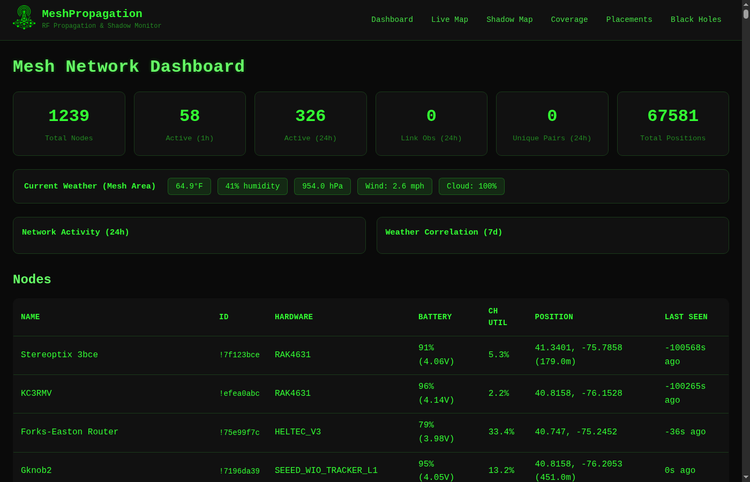
The dashboard is the home screen. At a glance you get total node count, how many are active in the last hour and 24 hours, link observations between node pairs, and how many nodes have GPS positions.
There's also a weather panel pulling live conditions – temperature, humidity, barometric pressure, wind speed, cloud cover. Why? Because RF propagation is affected by weather. Temperature inversions, humidity levels, barometric pressure changes – they all influence how far LoRa signals travel. The dashboard correlates that data over time so we can start seeing patterns.
Below that is a network activity chart showing traffic over the last 24 hours and a 7-day weather correlation chart. Further down, a full node table with hardware info, battery voltage, channel utilization, GPS coordinates, and last-seen timestamps.
Live Propagation Map
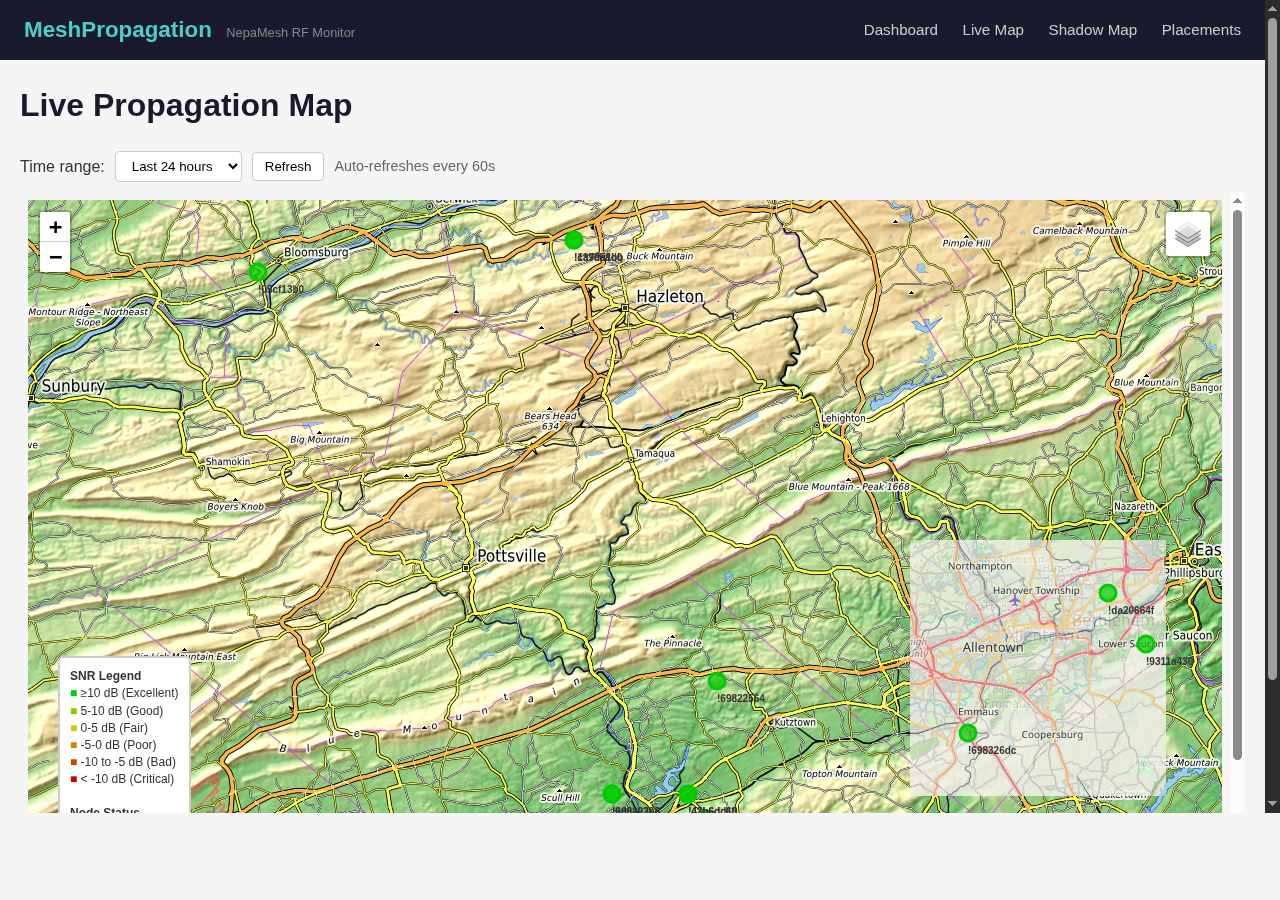
The live map shows actual RF links between nodes, color-coded by signal quality. Green is excellent (above 10 dB SNR), and it grades down through good, fair, poor, bad, and critical as the signal degrades.
You can adjust the time range from the last hour up to 7 days to see how propagation patterns change. The map auto-refreshes every 60 seconds, so you can leave it open and watch the network breathe.
This is the kind of thing that's hard to get a feel for just by looking at node dots on a map. Seeing the actual links and their quality tells you where the mesh is strong and where it's held together by a thread.
RF Shadow Map
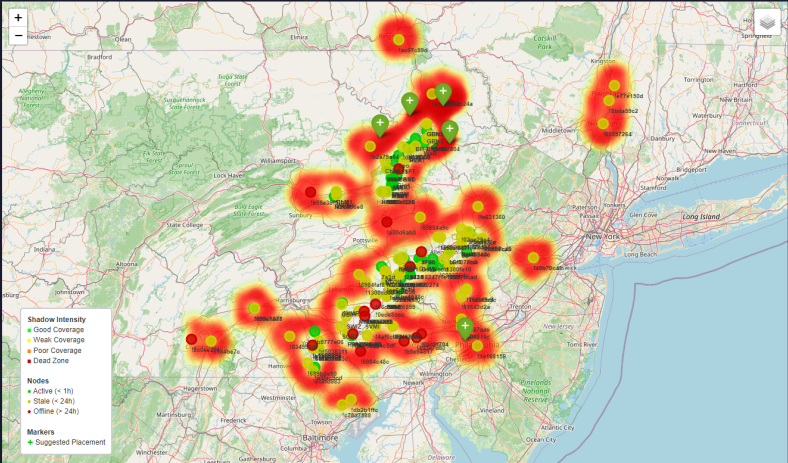
This is probably my favorite feature. The shadow map analyzes terrain and existing node positions to identify RF dead zones -- areas where signal can't reach because a mountain or ridge is in the way.
Red zones are coverage gaps. Green markers are algorithmically generated suggestions for where to put new nodes to fill those gaps. It's not just "put a node somewhere in this general area" – it's doing actual terrain-aware analysis to find the spots that would make the biggest impact.
The shadow intensity legend shows coverage quality from good (green) through weak, poor, and dead zone. Node markers show active, stale, and offline status so you can see what's actually contributing to coverage right now.
Node Placement Suggestions
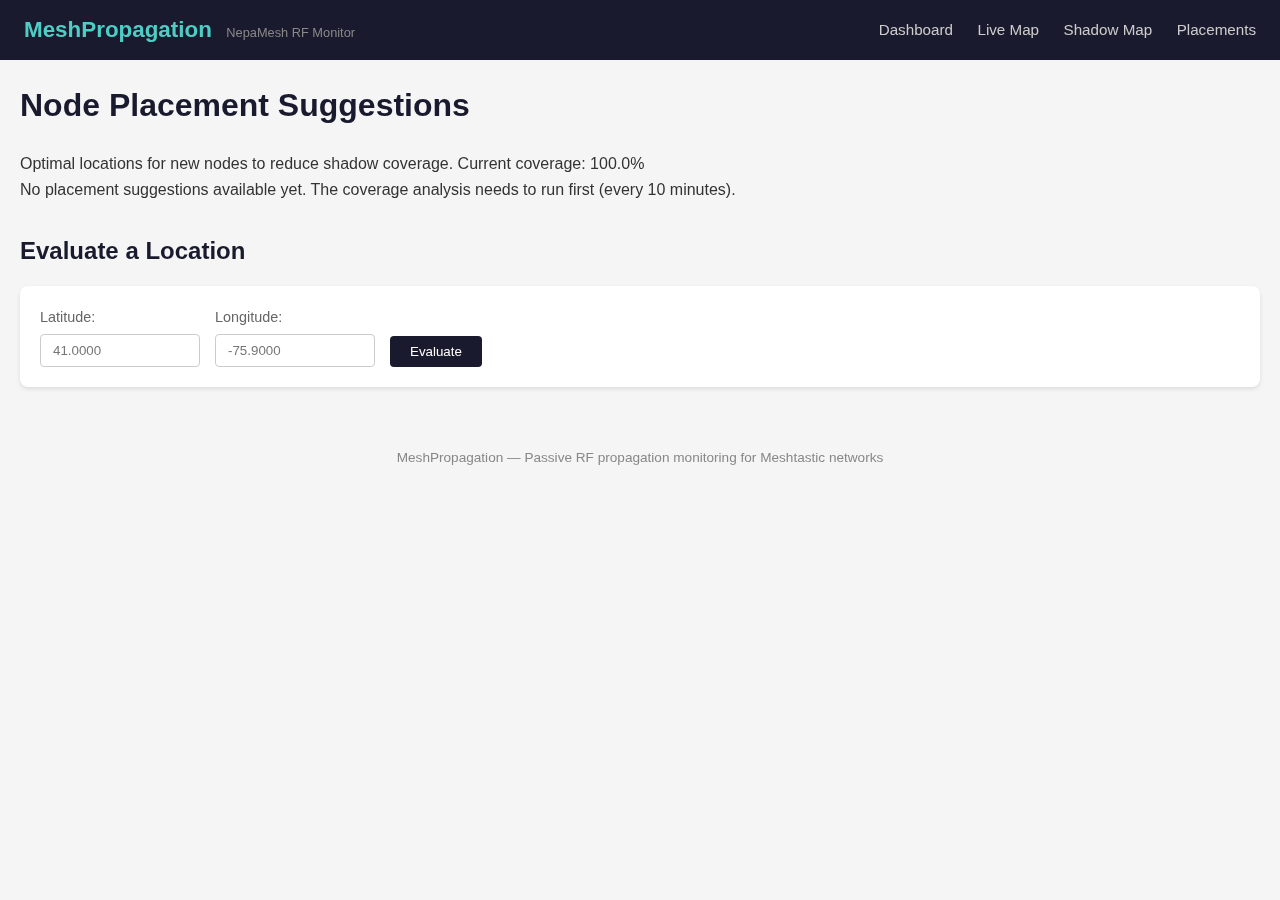
The placements page takes the shadow analysis further. It shows current coverage percentage and suggests optimal locations for new nodes. The coverage analysis runs every 10 minutes to stay current.
The "Evaluate a Location" tool is where it gets interactive. Punch in a latitude and longitude and it will tell you the elevation at that point, how much RF shadow it would eliminate (in square miles and percentage), and exactly how many coverage cells would improve. So before you climb a mountain with a solar panel and a RAK, you can check whether it's actually worth it.
Per-Node Details
Click on any node in the dashboard and you get a detail page with everything the system knows about it -- hardware type, battery level, channel utilization, air utilization, GPS position, and a 48-hour battery history chart. Useful for keeping an eye on solar nodes or figuring out which devices are draining faster than expected.
Coming Soon: Discord Bot
The web dashboard is just the start. I'm working on a Discord bot that will bring propagation data into the NEPAMesh Discord server. Think node status checks, coverage queries, and placement evaluations without leaving the chat. It's not ready yet, but it's coming.
More details on that when it's closer to launch.
When Can I Use This?
The site is live at propagation.nepamesh.com right now if you want to poke around. It's still in active development – features are being added and refined. Consider it an early preview.
If you have ideas for what you'd want to see, or if you find something broken, drop a message in the Discord.
Meshtastic is a registered trademark of Meshtastic LLC. Meshtastic software components are released under various licenses, see GitHub for details. No warranty is provided - use at your own risk. The Meshtastic logo trademark is the trademark of Meshtastic LLC. This post is not endorsed by or affiliated with Meshtastic LLC.