Propagation, Shadows, and a Discord Bot That Actually Knows the Mesh
Big news, friends -- we've been quietly building a thing, and today it gets to come out and play. propagation.nepamesh.com is live, the Discord bot is wired into the NEPAMesh server, and the whole stack is now open source on GitHub. It's a good day.
The short version: we're collecting every link observation the mesh produces, joining it against weather data and terrain, and using all of that to figure out where the mesh is strong, where it's weak, and where the next node should go. Then we exposed all of it as Discord slash commands so you don't have to leave the chat to check coverage. And now you can read every line of code that makes it tick.
What propagation.nepamesh.com Actually Does
Every time two nodes hear each other, that's a data point. SNR, distance, time of day, direction, the works. Multiply that by hundreds of nodes and tens of thousands of observations and you start to see patterns. Hot links that always hum. Cold pairs that should reach but don't. Routes that come alive at night and die at noon.
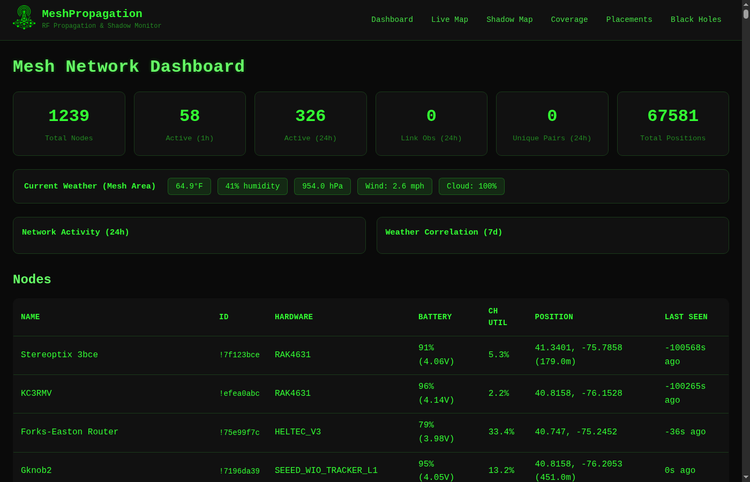
The site takes all of that raw mesh chatter and turns it into something you can actually look at. Live propagation map, weather overlays, dead zone analysis, placement scoring. Refreshed continuously off the same MQTT feed that drives map.nepamesh.com.
The pages
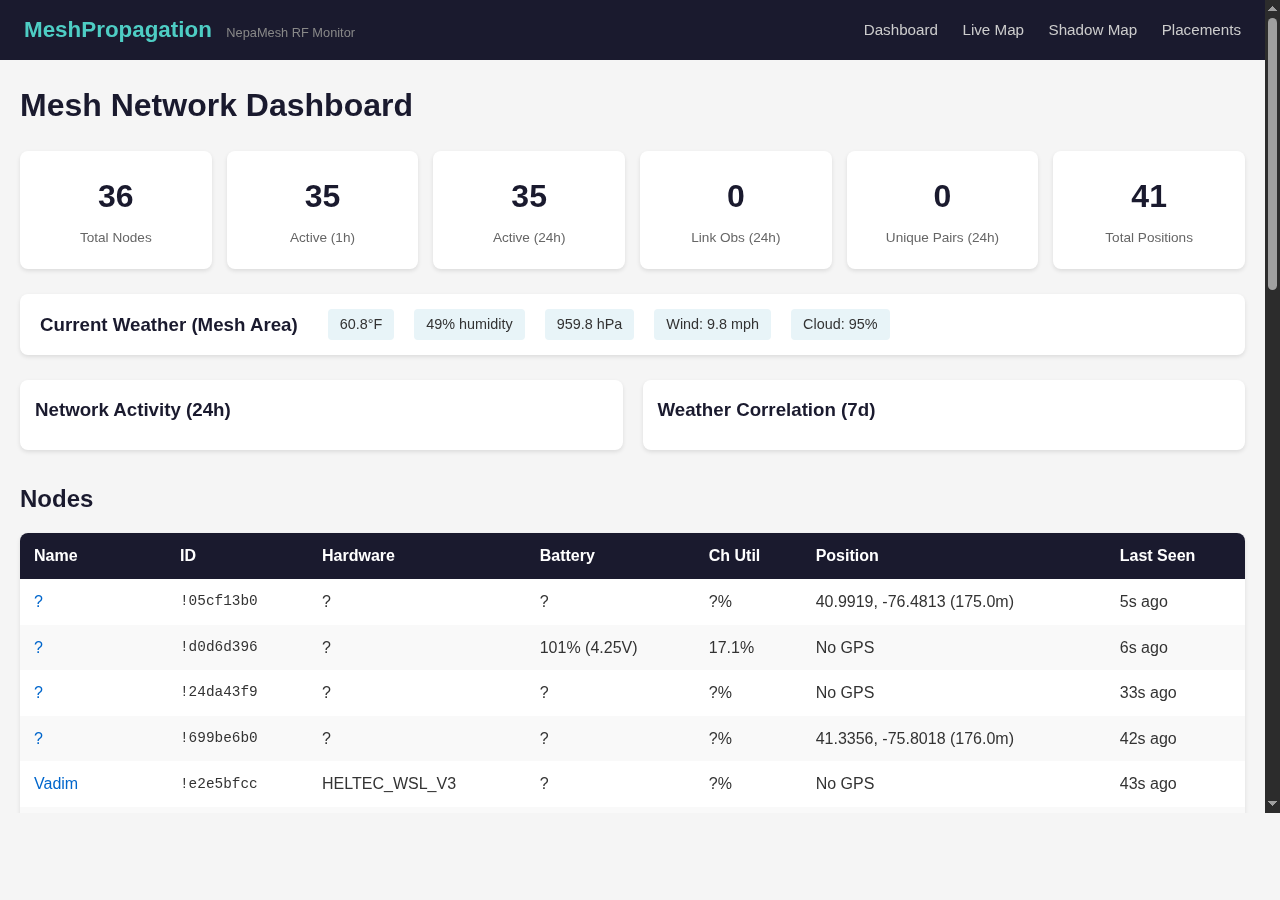
- Dashboard -- high-level numbers, top links, coverage grade, weather snapshot
- Map -- interactive RF propagation map, every observed link drawn live
- Shadows -- heatmap of where the mesh struggles, with named dead zones
- Suggestions -- ranked list of locations that would improve coverage most
- Per-node -- drill into any node for battery, position, recent links
All of it is read-only. You can't break anything by clicking around. Some of the panels are dense -- if a chart looks confusing, hover over it. Most of them have tooltips.
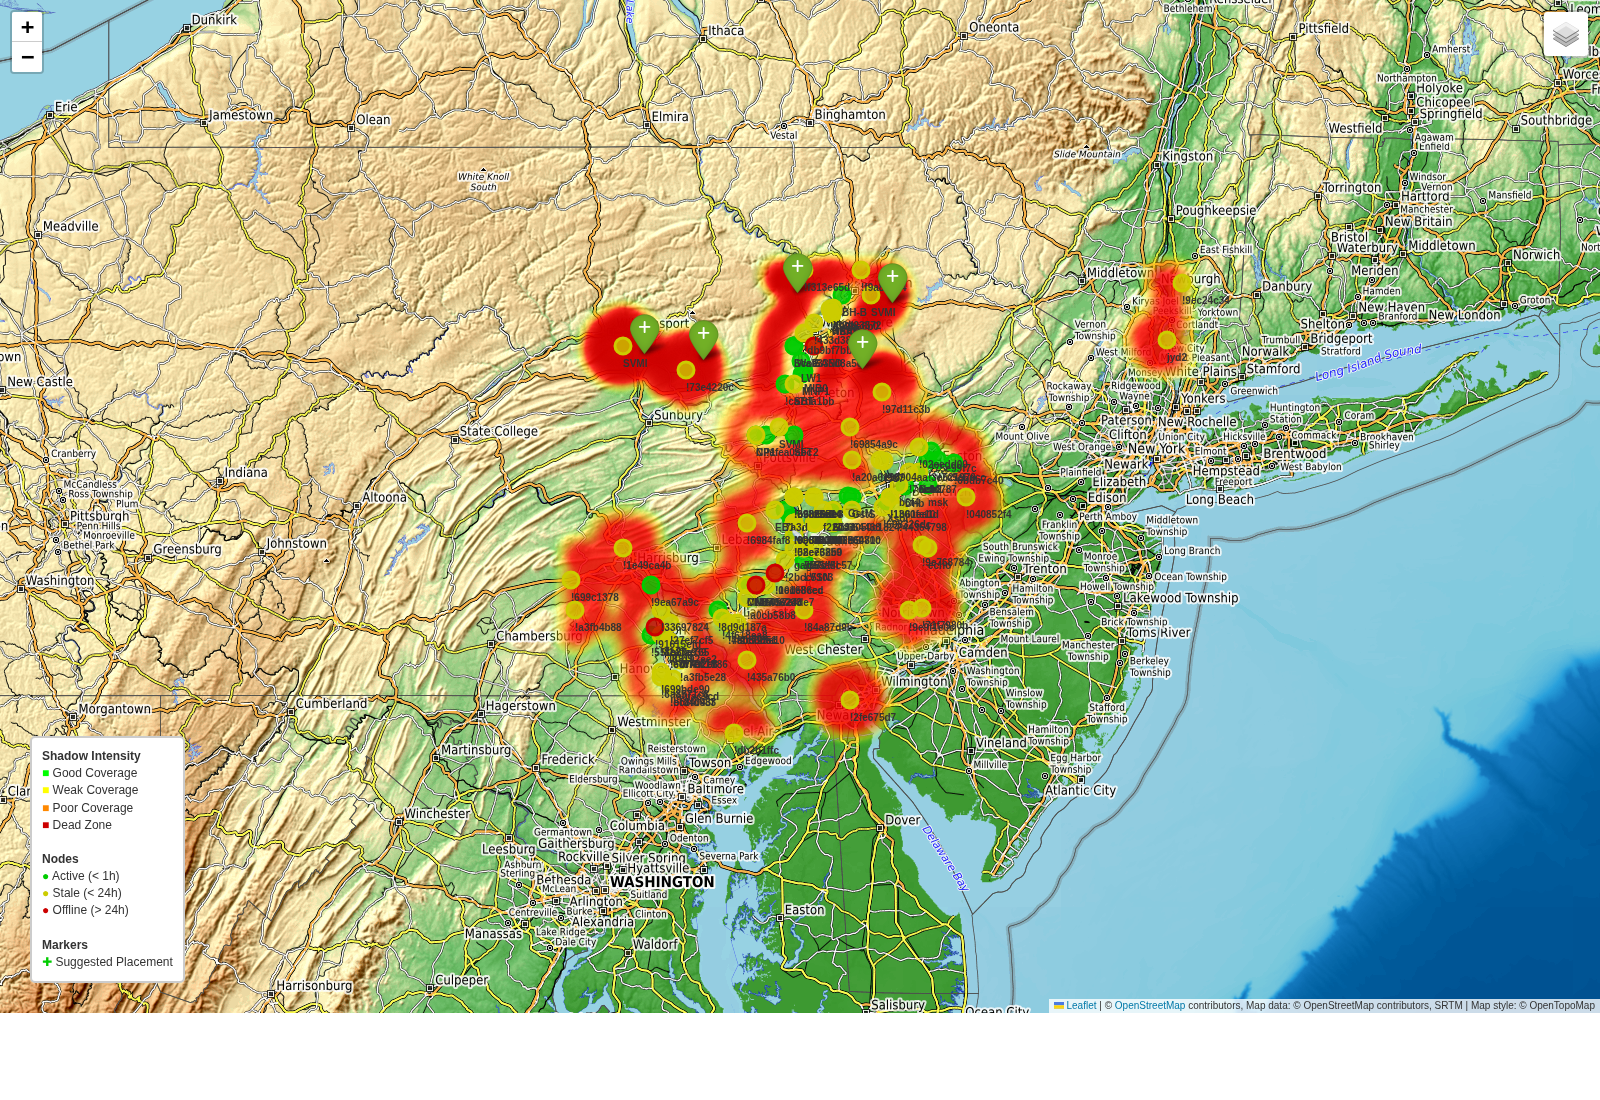
The Shadow Mapper
This is the part I'm most excited about, and honestly, getting it working felt a little like magic. Anyone running a mesh long enough learns where the dead spots are -- the valley behind the ridge, the hollow that swallows packets, the neighborhood nobody can reach. Knowing where they are is one thing. Quantifying them, naming them, watching them grow or shrink over time -- that's another.
Shadow Mapper takes the link observations plus terrain elevation data and builds a grid across the coverage area. Each cell gets a shadow score: how strongly the RF actually reaches there, given the surrounding nodes and topography. Cells with bad scores get clustered into named dead zones.
Coverage grading
The whole network gets a single letter grade based on how much of the area is well covered. A is 90% and up, F is below 60%. It's not a stat anybody else publishes for their mesh because it requires this kind of grid analysis to compute. We're hovering in the C/B range right now -- there's room to improve, and the suggestions engine tells you exactly where. Every uptick on that grade feels like a small celebration.
Placement Suggestions
Here's the part that turns the analysis into action. The suggestions engine looks at every cell on the grid that's currently in shadow, factors in elevation (a node on a ridge beats one in a valley), and finds the locations that would reduce the most shadow area if a new node were placed there.
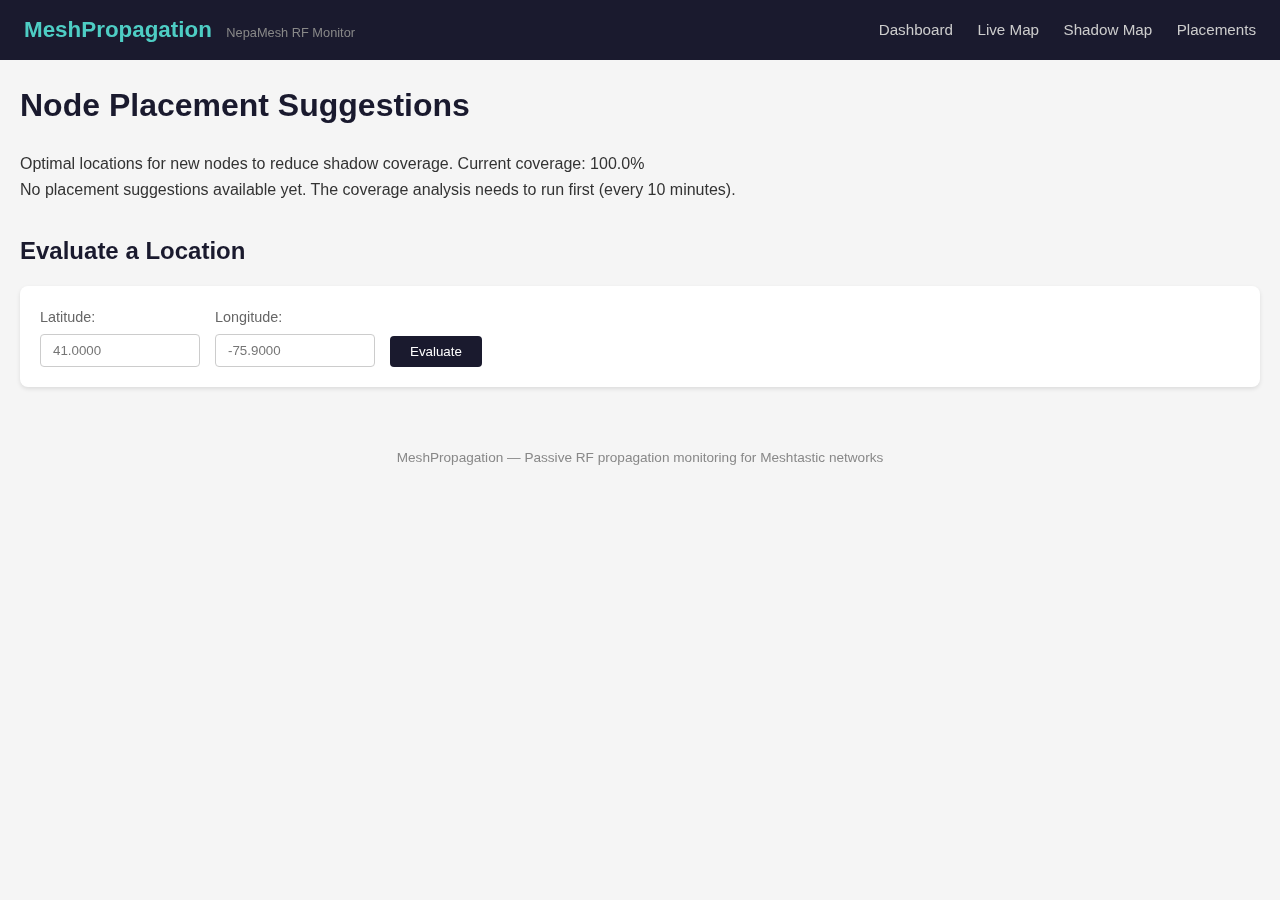
The output is a ranked list of latitude/longitude pairs with elevation and a shadow-reduction estimate. "Put a node here and you'd light up roughly two square miles that are currently dark." If you've been wondering whether to repeater-up your buddy's barn or your aunt's hilltop, this gives you an actual answer.
Heads up: These are mathematical suggestions based on terrain and current node positions. Real-world propagation has surprises -- trees, buildings, weather, your specific antenna. Treat the suggestions as strong hints, not gospel.
Weather Correlation
Pull up /weather and you'll see something most mesh dashboards don't show: how RF behaves against actual atmospheric conditions. The system pulls weather data hourly and joins it against link observations, so you get scatter plots of SNR vs temperature, humidity, pressure, cloud cover, wind, and precipitation.
After enough data accumulates you start seeing the patterns. Tropospheric ducting on high-pressure mornings. Signal fade during heavy precipitation. The kind of stuff old-school radio operators have known forever, but now we can see it in our own mesh -- and that's a delight every single time.
Anomaly Detection
The system runs anomaly detection on every link pair in the background. There are four kinds of events it watches for:
- Ducting -- SNR is significantly higher than the link's historical average. Often weather-driven, sometimes a sign that conditions are unusually good.
- Fade -- SNR has dropped below normal. Usually short-lived, sometimes the start of a longer issue.
- New link -- two nodes that have never been heard together before are now talking. Network growing.
- Lost link -- a previously reliable pair has gone quiet for several hours.
When any of these fire, the bot posts to the alerts channel automatically. Same for shadow events: new dead zones appearing, old ones being eliminated when somebody plugs the gap, sudden coverage drops above a threshold. The "dead zone eliminated" alerts in particular are pure joy -- somebody put up a node and the math noticed.
The Discord Bot
Everything you can see on the website, you can also pull up in Discord with a slash command. The bot lives in the NEPAMesh Discord and responds with embeds and rendered charts. Type / and start scrolling -- they're all auto-completed. Here's the full list.
Mesh and propagation
/propagation-- RF propagation map plus active node counts and 24h link totals./mesh-- Network-wide overview: total nodes, active counts, top links, weather./history [hours]-- Network activity chart. Default 24h, pass any number./weather [days]-- Weather vs RF correlation chart and current conditions. Default 7d./node <name>-- Drill into one node. Battery chart, position, hardware, uptime, last seen. Accepts short name, long name, or node ID.
Shadow Mapper
/shadows-- Shadow map overview. Coverage percentage, grade, active dead zones./coverage-- Coverage breakdown: total area, covered area, shadow area, dead zone count./coverage-history [days]-- Coverage trend chart. Did we improve or slip? Default 7d./suggest-- Top 5 placement suggestions, ranked by shadow reduction./deadzone <name>-- Detail view for a specific dead zone. Area, cause, shadow scores, center coords./evaluate <lat> <lon>-- Score a proposed node location. Tells you how much shadow it would eliminate if you put a node there.
/evaluate is the one that gets used most often once people find it. Punching in coordinates of your potential install location and getting back "this would clear X square miles" is satisfying in a way that's hard to describe.Auto alerts (no command -- they just happen)
- Anomaly alerts: ducting, fade, new link, lost link -- posted within a minute of detection.
- New dead zone detected -- when a previously-covered area goes dark.
- Dead zone eliminated -- when somebody fills a gap. Celebration time.
- Coverage drop alert -- when overall coverage drops more than 5%.
It's Open Source!
And here's the part we're most excited to share: the entire stack is now open source. Source code lives at github.com/nepamesh/MeshShadow. Web app, Discord bot, shadow mapper, anomaly detection, all of it.
If you run a mesh somewhere else and want to point this at your own MQTT feed, please do. If you spot a bug, open an issue. If you want to add a feature, open a PR -- we'd love the help. If you just want to read through and see how the sausage gets made, the code is reasonably documented and not too embarrassing. Star it, fork it, break it, fix it. That's what open source is for, and we couldn't be happier to finally hand it over to whoever wants to build on it.
Putting It to Use
The whole stack is meant to answer questions you probably already have. "Where should I put my next node?" -- check /suggest or /evaluate. "Why did my link go quiet?" -- check /node and look at the link history. "Is the mesh getting bigger or smaller?" -- /coverage-history will tell you.
If you're new to the mesh, the dashboard is a good starting point. If you're an operator looking to extend coverage, /suggest and the placement evaluator are where you'll spend most of your time. If you just like watching numbers go up, the dashboard auto-refreshes.
Under the Hood
For the curious: the backend listens to the same MQTT stream that feeds the map, stores everything in SQLite, and runs a handful of analysis passes on a schedule. Terrain data comes from a public elevation API. Weather from a free weather service. Charts are rendered with matplotlib server-side and shipped as PNGs to keep the web frontend lightweight.
Coverage snapshots get written hourly so we can build up the historical view over time. Placement suggestions are recalculated whenever the underlying shadow map changes. Anomalies are detected on a one-minute loop, dead zones on a five-minute loop. Nothing fancy, just a lot of small loops keeping the data fresh. (And again -- it's all on GitHub if you want to peek at how any of it works.)
What's Next
Plenty more on the way. A few things on the near-term list:
- Per-link history pages -- click any link on the map and see its SNR over time.
- Public placement evaluator -- you don't need Discord, just punch coords into a web form.
- Better dead zone naming -- right now it's directional, eventually it'll use actual neighborhood names.
- Multi-mesh support -- propagation analysis is generic, no reason it has to be NEPAMesh-only.
Hop into the NEPAMesh Discord and try the slash commands. Pull up propagation.nepamesh.com on a second monitor. Clone github.com/nepamesh/MeshShadow and break things. If something looks weird, broken, or wrong, say something -- the analysis can only improve with feedback from people who know the geography.
And if you're sitting on a hilltop wondering whether to put up a node, run /evaluate with your coordinates first. Five seconds of typing might save you a weekend of work for nothing -- or confirm that yes, you really should put that solar repeater up there. Either way, happy meshing.
Meshtastic is a registered trademark of Meshtastic LLC. Meshtastic software components are released under various licenses, see GitHub for details. No warranty is provided - use at your own risk. The Meshtastic logo trademark is the trademark of Meshtastic LLC. This post is not endorsed by or affiliated with Meshtastic LLC.